Addressing privacy concerns in driver risk management

By Ed Dubens (pictured), CEO/Founder of eDriving Today, data security and privacy compliance are among the most important considerations for practically every business. For that reason, when reviewing digital driver risk management solutions, data security and privacy compliance are critical components of the assessment and planning phase, and can even be the deciding factor in whether a programme is […]
Motorparc: Total vehicles on UK roads falls to 40.35m
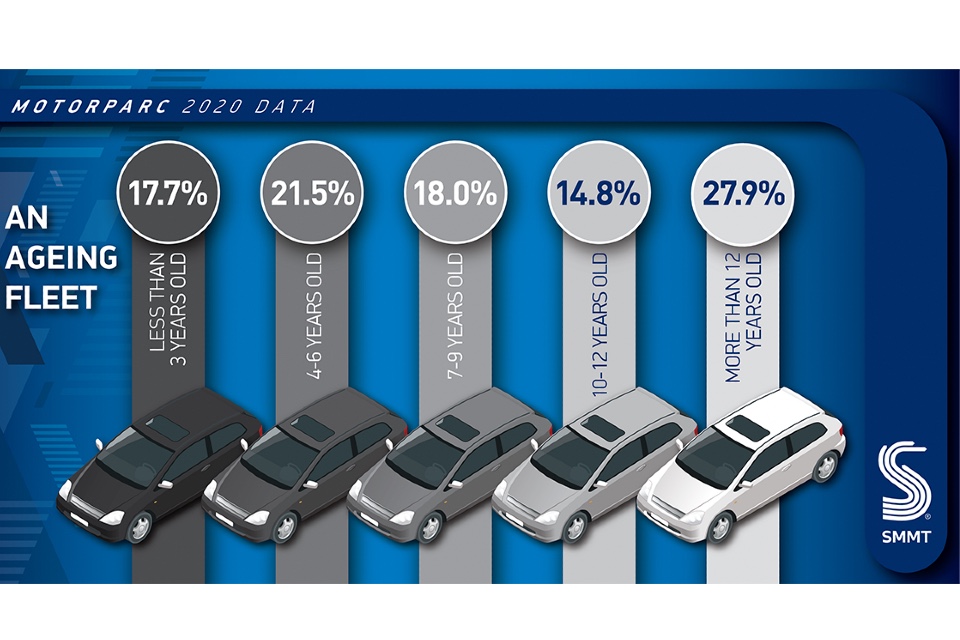
Vehicle numbers on UK roads fell to 40,350,714 in 2020, according to Motorparc data released today by the Society of Motor Manufacturers and Traders (SMMT), the first time the total number has fallen since the global financial crisis of 2009. As the pandemic stifled new vehicle uptake, the average age of cars on UK roads […]
Plug-in hybrid range figures causing P11D issues

Fleets are facing issues with obtaining the zero-emissions range (ZER) figures they need for plug-in hybrids due to complications in how vehicle data is processed and stored. That’s according to the Association of Fleet Professionals (AFP), which says that PHEVs registered on or after April 6h 2020 that emit 50g/km or less of CO2 need […]
UK’s most popular new car colour? Grey of course
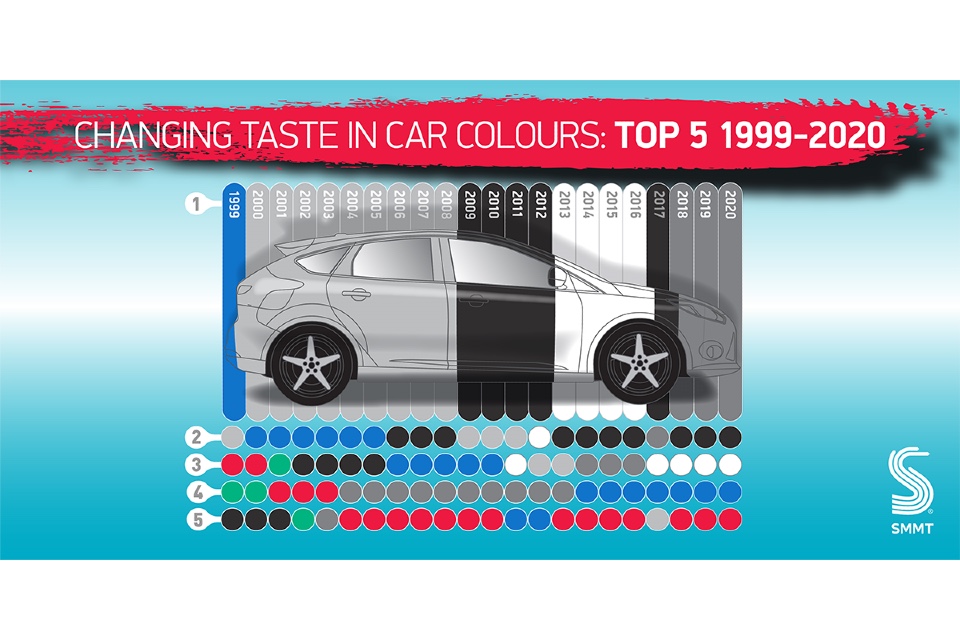
Grey retained its position as the UK’s favourite new car colour in 2020, according to the latest figures released today by the Society of Motor Manufacturers and Traders (SMMT). While it was a tough year for new car registrations overall, 397,197 grey units were sold over the course of 2020, which means that just shy […]
Lightfoot: Delivering robust returns for some of the UK’s largest and most complex fleets
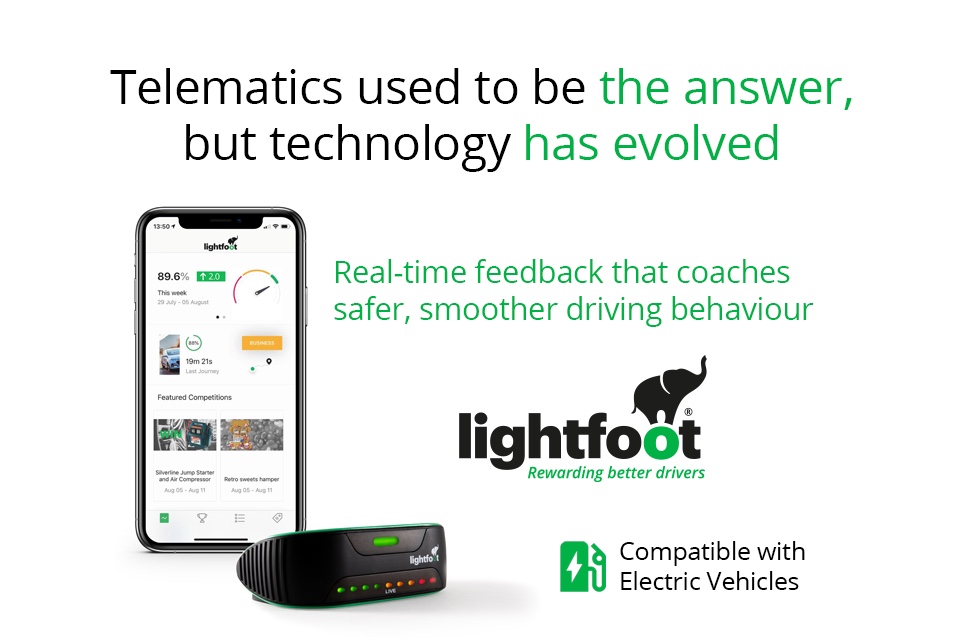
Many of the companies who turn to Lightfoot have had telematics systems for years which have always provided a wealth of data to managers, who are then in turn relied on to communicate this information back to drivers. Companies have realised that this approach is fundamentally broken and the wrong way around. Instead, they look […]
RAC: We’re more dependent on the car than a year ago

35% of UK drivers – equivalent of 14.7m people – say they are more dependent on using their car than 12 months ago, with public transport seen as an expensive and unreliable alternative. That’s according to data released as part of the latest RAC Report on Motoring, which show a further rise in the proportion of […]
GUEST BLOG: Maximising uptime through a data driven approach to rental

David Brennan (pictured, above), CEO of Nexus Vehicle Rental, discusses the benefits of maximising uptime through a data driven approach to rental… As consumption habits continue to shift from ownership to usership, vehicle rental has become an integral part of businesses’ mobility plans across a wide variety of industries including logistics, construction, retail and even […]
Understanding Vehicle Procurement: Why Cheaper Doesn’t Equal Better
By AssetWorks Often, vehicle replacement and procurement processes cause a slew of headaches for fleet managers and analysts. Many fleet organisations struggle with vehicle procurement, especially when deciding whether to purchase a more expensive vehicle, or the lower cost option. In most cases, cheaper does not equal better. While the cheapest option maybe the best option […]
Epyx targets fleet remarketing with tracking reports

Epyx has launched new online reports designed to help fleets gain a better picture of their remarketing activity in the face of burgeoning data points. The Insights Reports are being made available to businesses that use the company’s 1link Disposal Network platform to defleet company cars and vans through a wide variety of channels. The […]